Price-to-earnings (P/E) ratio
The price-earnings ratio (also called PE multiple or P/E) is a financial ratio that investors on financial markets use to estimate the valuation of a company.
As an example, it can be used by someone who is looking to invest in a public company in a given sector but is still deciding between competitors. The price-to-earnings ratio makes it possible to:
- see what people are willing to pay for a share in a business
- compares that with other companies in the sector or against its historical data
Dimitri Joël Nana is Director, Portfolio Risk at BDC. He explains what the P/E ratio is and how it can help investors as well as businesses who want to see how they measure up against the competition.
What is the P/E ratio?
The P/E ratio is used to assess the value given to a company by investors. “In other words, the P/E ratio determines how much you are able to pay on financial markets to acquire a share of the company,” says Nana.
Because even if two companies have the same net income, that does not mean they are valued in the same way on financial markets. “The P/E ratio can be doubled between these two companies, so you have to look at the underlying reasons before deciding where to invest,” he says.
P/E ratio formula
To calculate the P/E ratio, take the unit price of a company share on the financial markets and divide it by the earnings per share.
How to calculate the P/E ratio using a balance sheet
All of the key information for calculating the company’s earnings per share is available in the financial statements.
- The company’s net income can be found in the income statements.
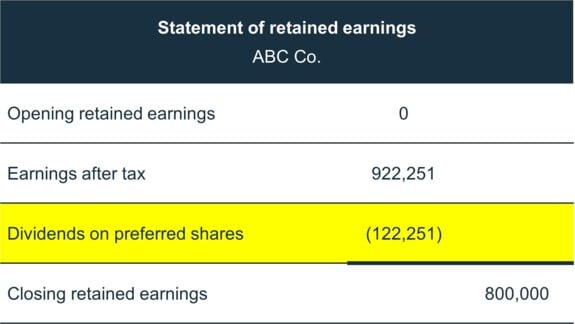
- Dividends on preferred shares are found in the statement of retained earnings section.
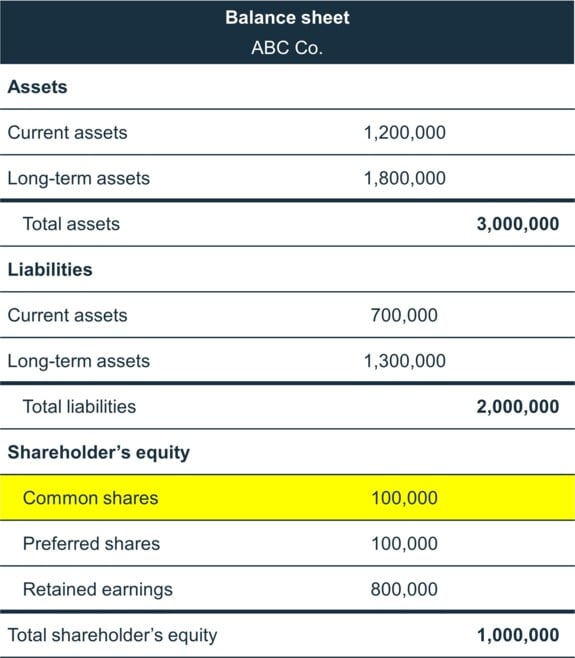
- The number of common shares is found on the balance sheet, in the equity section.
Example of an income statement showing net income:

Example of a statement of retained earnings showing dividends on preferred shares:

Example of a balance sheet showing the number of outstanding shares:

Then, you simply need to go online to see the unit price of a company share, sometimes called the share price.
Once you have this data, you can calculate the earnings per share and then the P/E ratio.
Here is the calculation for Company ABC:
1. Calculate the earnings per share
So earnings per share for Company ABC equals 8.
2. Calculate the P/E ratio
Company ABC’s P/E ratio is therefore 10.10.
To save time
Most web platforms that provide share prices also show the company’s P/E ratio. This ratio can also be easily found with a search engine.
Other sample calculations of the P/E ratio
Company A
Share price on financial markets: $3
Earnings per share: 0.17
To obtain this ratio, which measures a company’s earnings per common share, its net profit was used ($20,000), less the dividends on preferred shares ($3,000), divided by the number of common shares (100,000).
P/E ratio: 17.65
Company B
Share price on financial markets: $20
Earnings per share: 0.67
To obtain this ratio, which measures a company’s earnings per common share, its net profit was used ($20,000), less the dividends on preferred shares ($10,000), divided by the number of common shares (15,000).
P/E ratio: 29.85
Analyzing a company’s P/E ratio
Let’s say company A, which has a unit price per share of $3, keeps the same net profit over time, i.e., $20,000. That means that each year, all other things being equal, a person who purchased a share will receive $0.17.
“It will take them 17.65 years to recoup the $3 they invested to buy a share,” says Nana. “Money will be generated in subsequent years (relative to the initial amount invested).”
Let’s now take a look at Company B. Let’s say they also maintain the same net profits over time, i.e., $20,000. That means that each year, all other things being equal, a person who purchased a share will receive $0.67.
The person who bought a share in Company B will need 29.85 years to recoup the $20 they originally invested.
“In general, a smaller P/E ratio is preferable, so in this example it would be Company A since the person would get their initial investment back faster,” says Nana.
If two companies have the same P/E ratio, such as 0.17, but the unit price of their shares on the financial markets is different ($3 and $5), then the $3 unit price would be preferable. “Because all other things being equal, less money would have to be invested for the same return,” says Nana.
But you always have to make sure you’re comparing apples to apples. “You can’t compare the P/E ratios of two companies if they’re in different industries,” says Nana.
What constitutes a good price-to-earnings ratio?
Historically, a P/E ratio between 20 and 25 is considered good. “But in reality, it also depends on the industry,” Nana says. “It’s better to analyze the averages by industry in order to get a clearer picture.
However, there are some differences. For example, let’s take the automotive manufacturing sector, with Tesla and Honda. “The first company is often seen as a growth stock (a company with high future potential), while the second is seen as a value stock (a mature company),” Nana says. “So they can’t really be compared.
Tesla’s P/E ratio is very high: its share price is high, although the net income is low because the company reinvests its profits to maintain growth with a lot of new projects and innovation. As a result, investors expect Tesla to experience stronger growth in the future.”
Conversely, a value company like Honda will reinvest less and pay more dividends to shareholders. “Investors will be reluctant to accept a high P/E ratio for a mature company with low growth potential,” Nana adds.
Comparing companies in the same industry, but in different countries, can also be risky. “For example, production methods may be completely different from one country to another, so it will be difficult to compare two companies even if they are in the same sector,” he says. “An example would be conventional oil extraction, as seen in the United States, compared to Canadian oil sands.”
What does a negative P/E ratio mean?
A negative P/E ratio implies that the company’s earnings per share are negative. For example, if a company had a price per share of $48 and its earnings per share were -$1.17, its P/E ratio would be -41.03.
A statement saying that the P/E is not applicable is sometimes used instead of showing the negative number, which is not relevant.
Why is the P/E ratio useful when comparing two companies?
When there are two companies in the same industry with similar activities and of the same type, i.e., with similar growth forecasts, the P/E ratio is a better indicator of the company’s value than just its share price. “The P/E ratio indicates not just the share price, but also how much capital market investors are able to pay for $1 of the company’s net profit,” says Nana. “If the difference between the ratios of the two companies is significant, there should be good reasons for it.”
Comparing a company’s ratio over time
The P/E ratio is also useful for conducting a time analysis. “You can look at each company’s growth over time by tracking that ratio as well as the ratios of its competitors,” Nana adds.
For example, if Company B has a ratio of 30 whereas it was 40 in the previous year, you have to wonder whether its growth forecasts have deteriorated. Otherwise, it could be a better purchase price than the previous year.
What are the limitations of the P/E ratio?
On the one hand, the P/E ratio’s numerator, the share price determined by financial markets, has certain limitations.
“Share price is influenced by the sentiment/perception of the financial markets,” says Nana. “For instance, if a war breaks out, the share prices of companies in the surrounding areas may fall, even if they are not affected.”
Another influencing factor is media coverage. “A company with a lot of media coverage has a good chance of selling its shares at a higher price on the markets than a company with equally good potential, but that is not known to the public,” Nana notes.
On the other hand, an exceptional event may occur during the year that will have a negative impact on the earnings per share. “This may be an unusual year and the EPS may have been positive for the last nine years,” Nana mentions. “We can then decide to do an average over the past 10 years to qualify this particular element. This is known as the Shiller P/E ratio.”
The P/E ratio could also be determined with estimated earnings per share, i.e., projecting the company’s earnings for the next year. “So we’re projecting into the future, but you have to make sure to properly research the company’s growth potential,” Nana says.
Estimated Earnings per share for the next fiscal year
Another solution would be to adjust the P/E ratio for the company’s anticipated growth. This is known as the price/earnings-to-growth or PEG ratio. “Therefore, for two companies with the same P/E ratio, there is an advantage in investing in the company with the highest expected growth,” he adds.
Ultimately, the P/E ratio is useful to calculate to get a good idea of a company’s value, but it’s even better when you also take other ratios and elements into account in your analysis. “The debt ratio is also a consideration,” Nana says. “Just as with the return on equity (ROE) ratio, the more elements you look at, the more accurate the picture.”
Next step
Find out how to boost your bottom line with our free guide for entrepreneurs, Building a More Profitable Business.